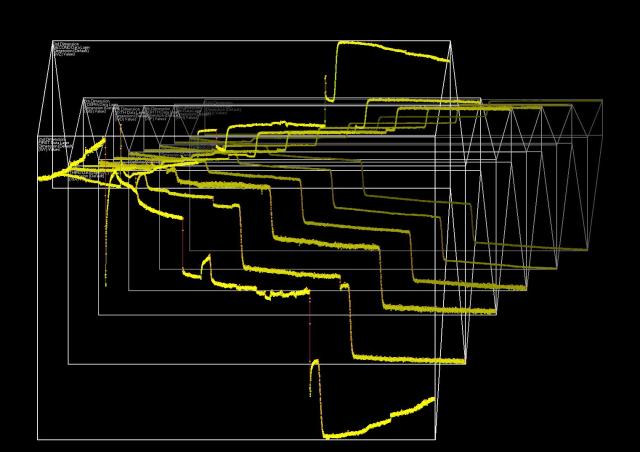
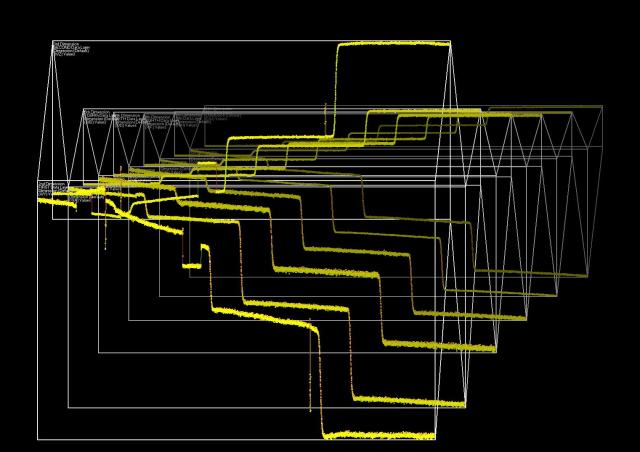
Q-Sense are exhibiting at this NMAET conference and sent me sample data for visualizing.

Raw time series of 12 parameters

A second set of time series

And now the two series together
To help with “visual clarity”, let’s bring some order to the first series:

Twelve Time Series of 7764 points each over one time period
Here is the second set sorted.

A second time series of twelve parameters
And finally, I put the two series together and sorted them for “visual ease” and comparison:

Two series packed into one
Do let me know how useful this may be for your complex data sets or time series!
About Sabine Kurjo McNeill
I'm a mathematician and system analyst formerly at CERN in Geneva and became an event organiser, software designer, independent web publisher and online promoter of Open Justice. My most significant scientific contribution is now a solution to the Prime Number problem: https://primenumbers.store/


